TECHNICAL ANALYSIS
Technical analysis is based upon studying price movements using price patterns and/or statistical data. It has gained in popularity over the past decade, especially with the new innovations and developments in technology. This has allowed traders the ability to analyze movements and trends much faster using computers. Technical analysis offers insight into what gold traders are doing. Traders use charts to identify patterns and trends to make successful gold trading decisions. Technical analysis can be used in different time frames. Whether it is monthly, daily, hourly, or even minutes, a trader gets to choose the time frame that suits his forex trading style best. Three widely used concepts of technical analysis are:
- Support and Resistance levels
- Trends
- Fibonacci Retracements


SUPPORT AND RESISTANCE
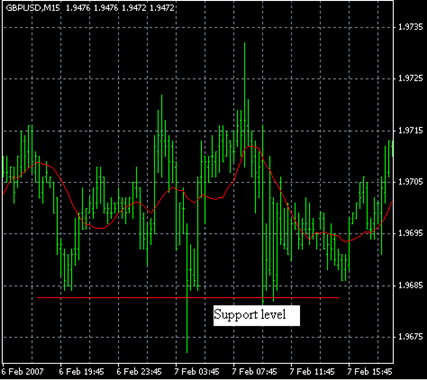
Support can be defined as the "floor" through which the currency pair has difficulties falling below.
Resistance, on the other hand, is the opposite: the "ceiling" through which the currency pair has trouble breaking.
The reason why the price has trouble breaking these levels is the existence of actual orders around these levels. There is no formula to accurately calculate these levels, they are observed by watching the market and hence involve a subjective element.
TREND
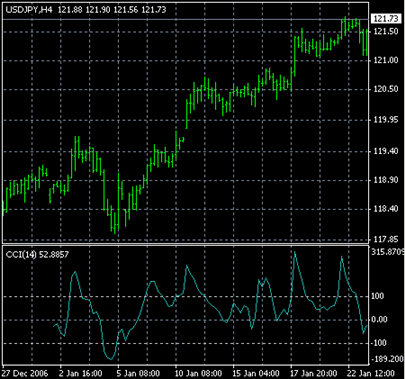
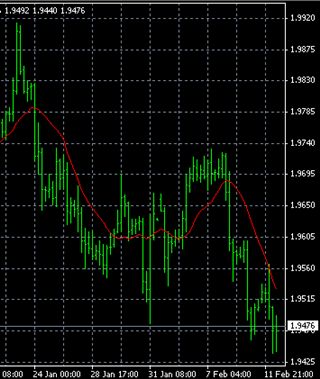
Trends are simply the general direction that the currency pair is moving. It could be up, down or sideways. The length of the trend determines its strength. In an uptrend, there should be at least 2 low points on the chart with the 2nd point higher than the first. In downtrends, there should be 2 high points with the 2nd point lower than the first. Sideway trends have 2 upper points at the same price and 2 lower points also at the same level. A channel is formed when prices trend between a well defined trading forex trading range.
TREND CHART

FIBONACCI RETRACEMENTS
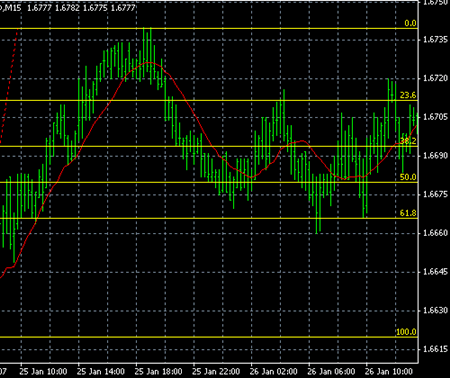
These are the levels at which the market is expected to retrace to after a trend. Fibonacci retracement key levels in most markets are: 38.2%, 50% and 61.8%. Suppose a currency pair is on an uptrend from 1.2000 to 1.3000, which is a 1000 pip rally. When the currency pair reaches 1.3000, how much will it retrace? 38.2%: The size of this movement is 1000 pips. So 1000 * 0.382= 382 pips. Therefore, after rallying 1000 pips we expect the currency pair to retrace 382 pips.
Using similar calculations we find out that after a 1000 pips rally a currency pair would retrace 500 pips back to the 50% level and 618 pips back to the 61.8% level. Obviously, the 50% level is a more significant buying level than the 38.2% and the 61.8% is the most significant.
*Disclaimer: We do not recommend these charts to be used for trading. They are not updated with the frequency that is necessary to trade. They are only there as a guide and cannot be relied upon for accurate trading.


